

Revenue
Acceleration for PE
Backed SaaS Companies
Increase Qualified Outbound Pipeline 30–50% Within 90 Days Without Adding Headcount
Focused on Pipeline Coverage, SDR Productivity, and EBITDA Expansion.
The Revenue Constraint
Post-Acquisition
Most PE-backed SaaS companies face revenue inefficiencies before scaling headcount.
Pipeline coverage below 3x
Inconsistent SDR productivity
Rising CAC
Manual outbound workflows
Board pressure for EBITDA expansion
Limited executive visibility
Scaling headcount before fixing outbound inefficiencies increases cost without improving revenue velocity.

The 90-Day Revenue Acceleration Sprint

Phase 1:
Diagnostic
Funnel audit, SDR productivity analysis, outbound performance review.

Phase 2:
AI-Driven Outbound Engine
Personalization automation, segmentation, qualification systems.

Phase 3:
Revenue Optimization
KPI dashboards, workflow automation, SDR systemization.
Focused on measurable impact:
Every phase is tracked against the metrics your board and operating partners already report on.
What Changes in 90 Days
Before:
1.8x Pipeline Coverage
6 Meetings per SDR
Manual Follow-Up
Limited Reporting
After 90 Days:
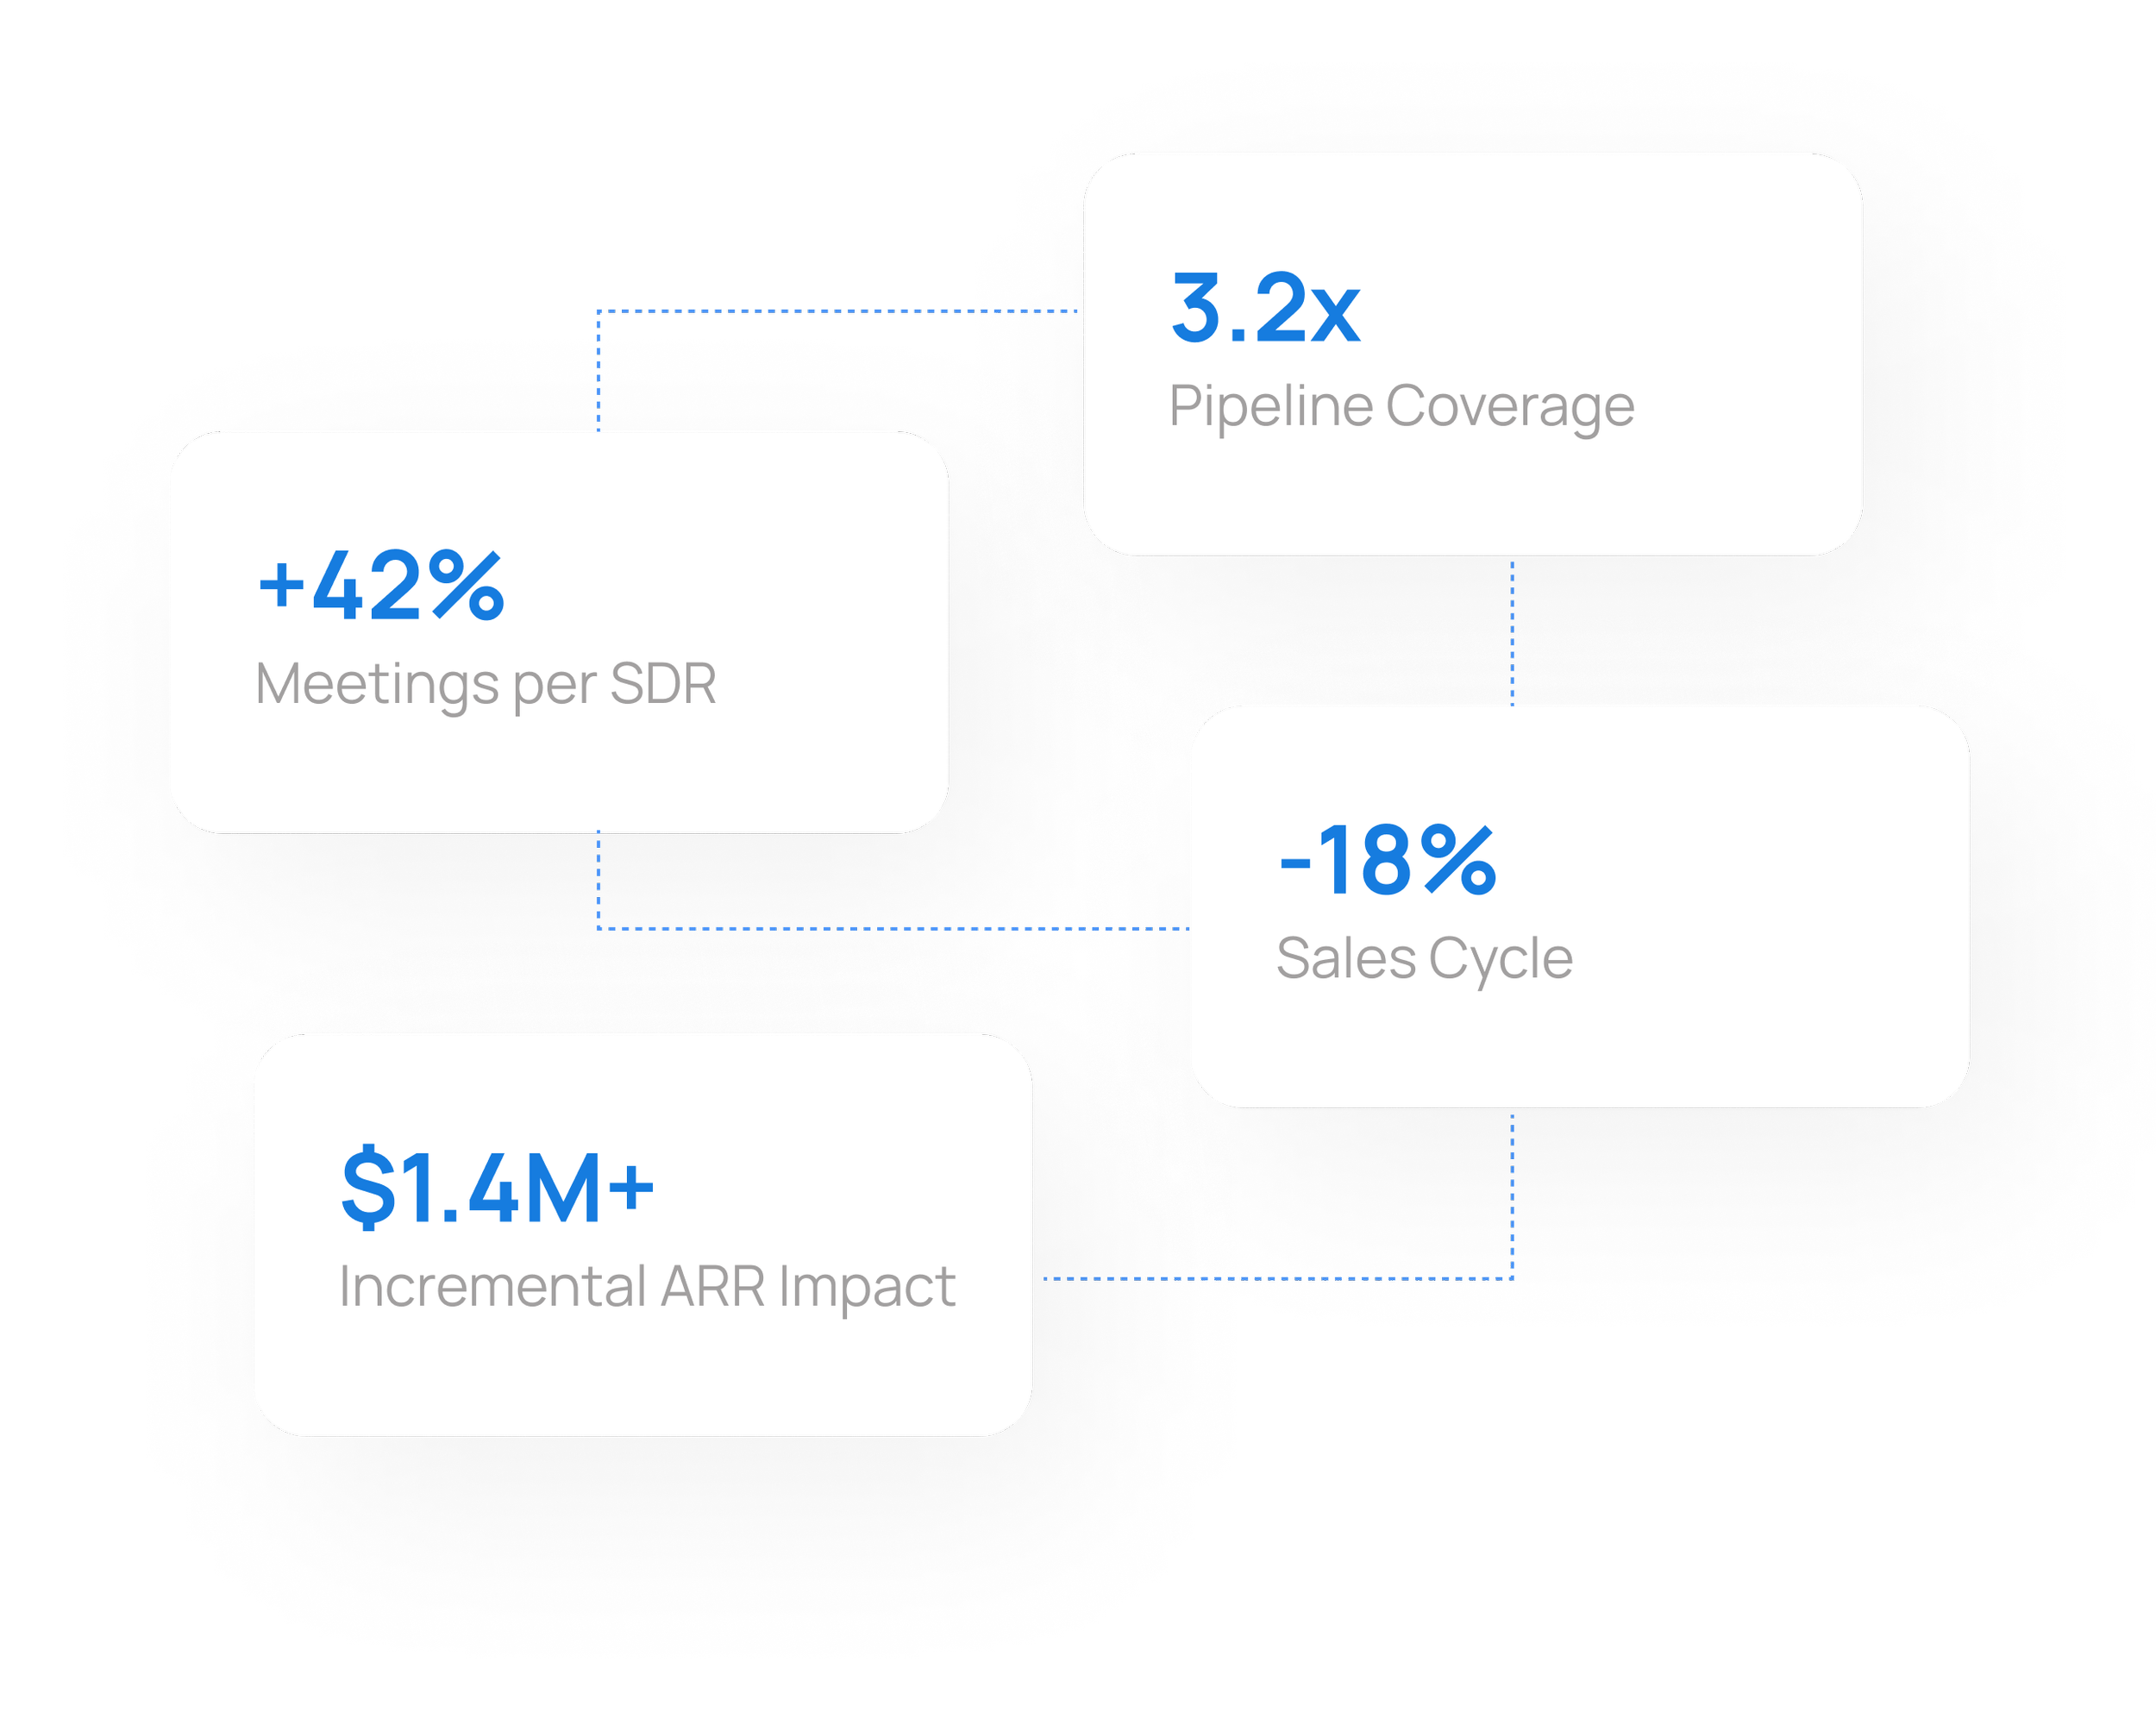
3.2x Pipeline Coverage
+42% SDR Meetings
Automated Multi-Touch Outbound
Executive-Level Funnel Visibility
Estimated Incremental ARR Impact: $1.4M+
Revenue Velocity as a Value Creation Lever
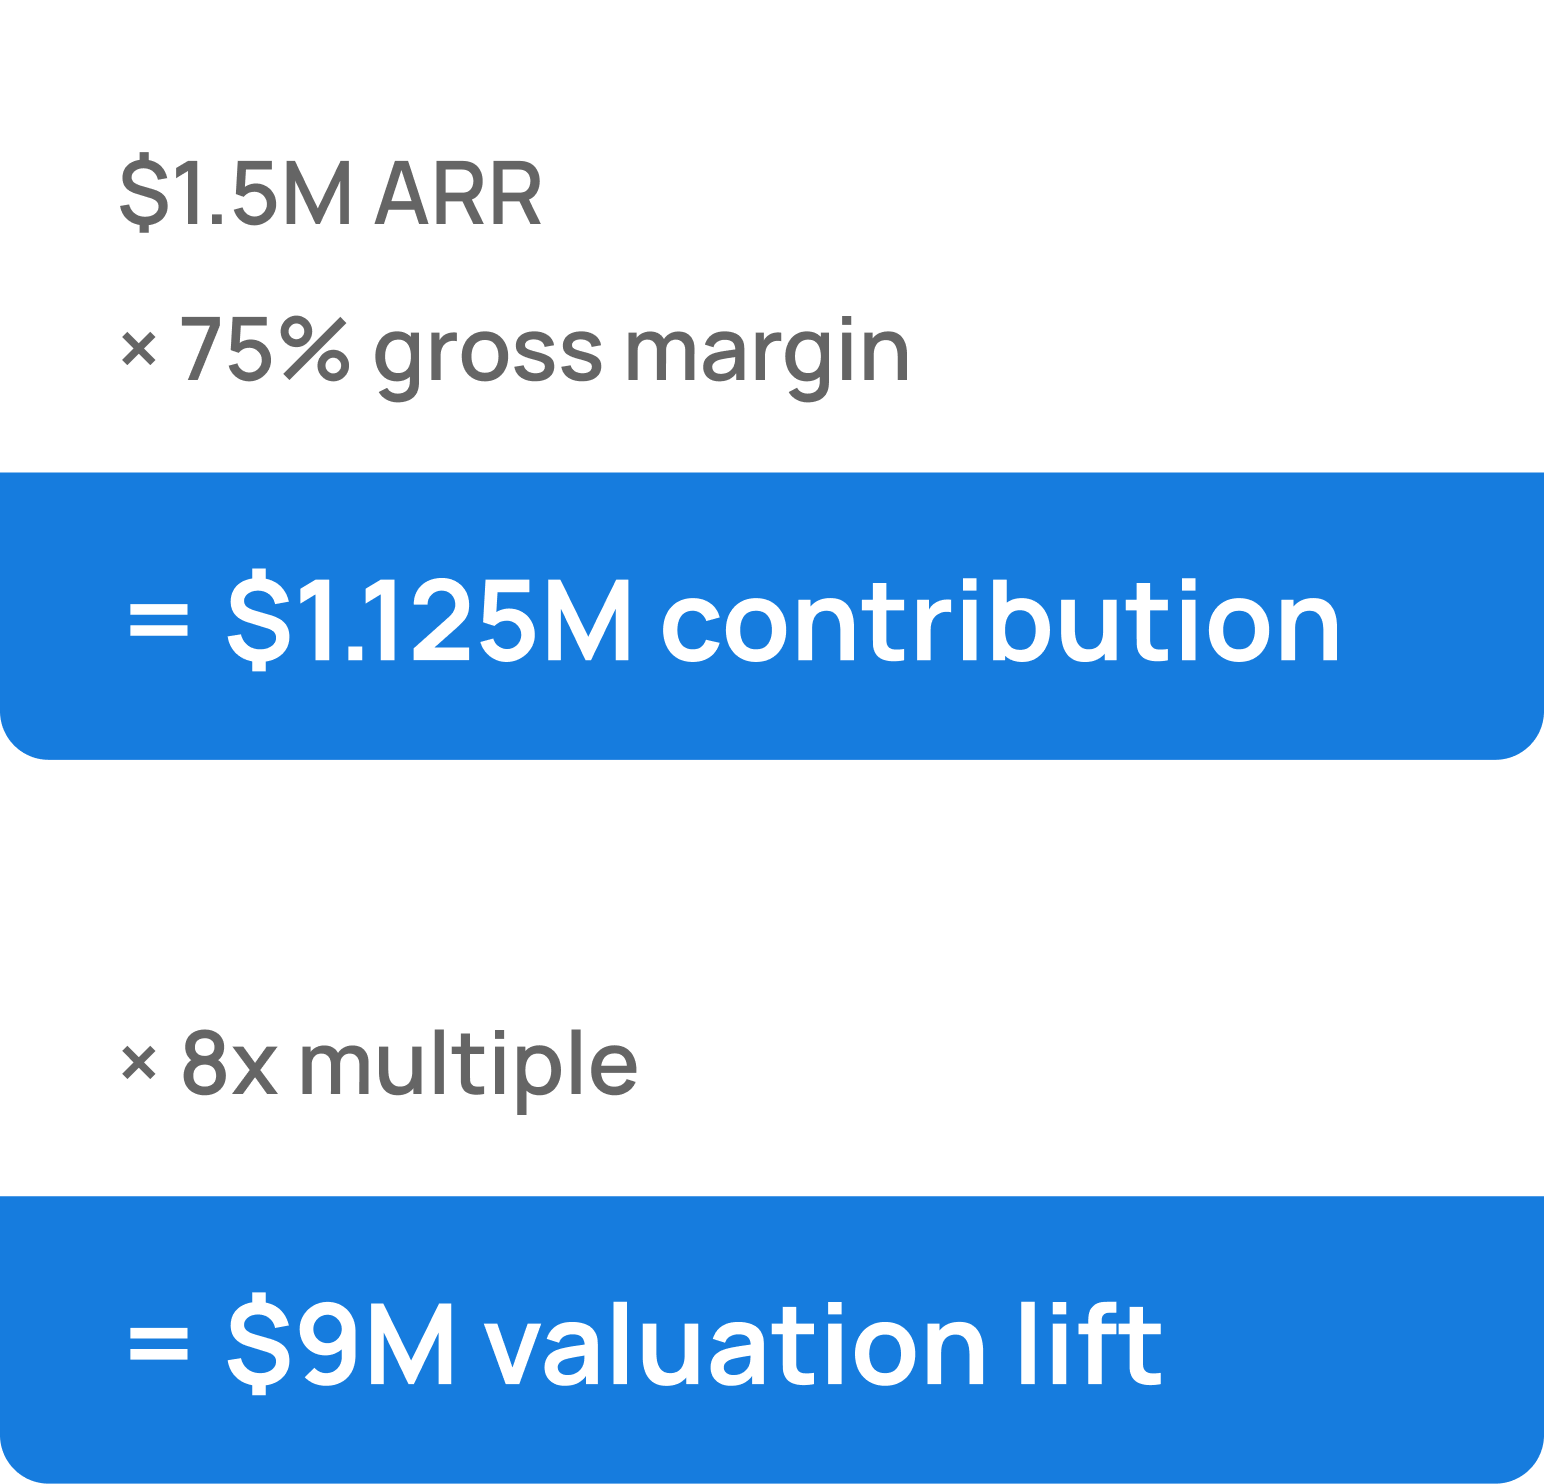
Incremental ARR drives EBITDA expansion, improves CAC efficiency, and strengthens exit multiples. Revenue productivity is one of the fastest value creation levers available post-acquisition.
Engagement Investment
90-Day Revenue Acceleration Sprint
Implementation: $25K–$35K

Portfolio-Level Revenue Diagnostic
We provide a no-cost Outbound Productivity Diagnostic for one portfolio company to identify immediate revenue lift opportunities within 30 days.
